


Abstract
Objectives. To investigate the feasibility of collecting rheumatoid arthritis (RA) patient self-administered outcome data using touch-screen computers in a routine out-patient clinic.
Methods. Forty patients with RA completed the touch-screen and paper Rheumatoid Arthritis Quality of Life Questionnaire (RAQol) in the clinic and rated ease of use and preference. Forty-five others completed the Stanford Health Assessment Questionnaire (HAQ) and visual analogue scales (VASs) for pain, fatigue and global arthritis activity on touch screen and paper and a joint assessment on touch screen. They rated ease of use and willingness to complete the assessment again. Joints were independently assessed, and completion times and technical problems recorded.
Results. No technical problems were encountered. The touch-screen RAQol took no longer to complete, was preferred by 64% (33% had no preference) and was rated significantly higher for ease of use (two-tailed P=0.003, n=40) even by computer naïve patients (two-tailed P=0.031, n=24). Intraclass correlation coefficients between methods were high for RAQol (0.986) and tender joint counts (0.918), and as high for the pain, fatigue and global activity (0.855, 0.741, 0.881) as for test–retest of the paper versions (0.865, 0.746, 0.863). Ninety-eight per cent rated the touch screen very/quite easy for HAQ and VAS, and 90% for joint assessment. Ninety-six per cent stated a willingness to complete the touch-screen assessment in clinic again.
Conclusions. Touch-screen questionnaires in the clinic can produce comparable results to paper, eliminate the need for data entry and afford immediate access to results. It is an acceptable, and in many cases a preferable, option to paper, regardless of age and previous experience of computers.
The use of self-completed questionnaires to monitor outcome of care for patients with rheumatoid arthritis (RA) has been widely advocated in clinical practice [1, 2] and it has been recommended [3] that all patients attending specialist rheumatology clinics should be routinely assessed by means of counts of tender and swollen joints, erythrocyte sedimentation rate (ESR) blood test, a patient assessment of global health on a 100 mm visual analogue scale (VAS) and the Stanford Health Assessment Questionnaire (HAQ) [4]. It has also been proposed that quality of life assessment could assist in evaluation of individual patient needs and priorities [5] at the clinical consultation.
Touch-screen technology offers the potential to facilitate the collection of data, saving time on administration, scoring and data entry and increasing utility by allowing immediate access to results. This study set out to develop touch-screen versions of a core set of RA outcome measures, namely the HAQ, graduated VAS for pain, fatigue and global disease activity, patient-assessed tender and swollen joints and the Rheumatoid Arthritis Quality of Life Questionnaire (RAQol) and to test the feasibility of using them in routine rheumatology practice. Questions of touch-screen questionnaire design, ease of use and acceptance by patients in the clinic, completion times and reliability of results were addressed.
The RAQol assesses the impact of RA on a patient's quality of life [6–8] and consists of 30 statements of ways in which the condition can affect everyday life, the score being the number that currently apply. The HAQ is a widely used and validated self-completed questionnaire for arthritis-related disability. The 28-joint swollen and tender joint count [9] can be combined with the patient's global VAS and ESR to produce the index of disease activity known as DAS28 [10], validated for use in clinical trials and currently used in the UK for assessing eligibility and response to biological therapy [11]. There is evidence that, given training, patients can assess their own tender and swollen joints [12, 13].
Methods
Design of touch-screen questionnaires
The questionnaires were adapted for touch screen using Microsoft Access software and a 15-inch LCD capacitive touch-screen monitor. The touch-screen HAQ and RAQol used the original questionnaire wording except for an additional option of ‘I cannot answer this question’.
The touch-screen VAS questions were ‘How tired have you been over the past week?’, ‘How much pain have you had from your joints over the past week?’ and ‘In general how active has your arthritis been over the past week?’. Patients were asked to respond by touching a horizontal line on the screen with anchors of ‘no pain/pain as bad as it could be’ for pain, ‘no tiredness/tired all the time’ for fatigue and ‘arthritis inactive/arthritis very active’.
The joints self-assessment questionnaire displayed one joint at a time as in Fig. 1. It concluded by summarizing all the answers on a diagram of the hands and body and giving the opportunity to make amendments if desired.
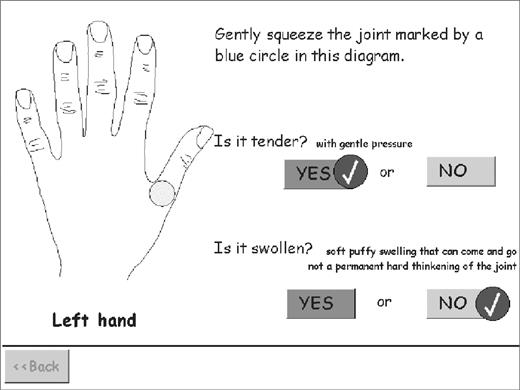
A screen from the touch-screen joint assessment questionnaire.
Prompts and reminders were set to appear in cases of moderate delays in response, and patients could go back and forwards and review/revise previous answers but could not, however, move on past a question for which they had not yet provided a response. Programs automatically advanced to the next question after receiving a response. The touch-screen RAQol advanced immediately and concluded with a ‘review and amend’ section (a summary of all the answers with an opportunity to make changes). The touch-screen HAQ, VAS and joint questionnaires first displayed a tick against the chosen response and paused for a few seconds before advancing to the next question. This enabled the patient to register the choice they had made and allowed time to change it if necessary before moving on. The ‘review and amend’ section of the HAQ was made optional. All results were automatically stored in a Microsoft Access database. The touch-screen RAQol proportionately adjusted for the use of the ‘I cannot answer this question’. The same adjustment was made for missing answers on the paper RAQol.
Evaluation of the touch-screen RAQol by patients in the clinic
Forty-three consecutive patients with RA attending the rheumatology clinic for routine appointments were invited to participate. Participants completed the RAQol (with additional questions on the impact of any statement that applied) in the clinic on both touch screen and paper, randomized to either touch screen or paper first. Finally they completed a questionnaire on preference, if any, for touch screen or paper, ease of use of touch screen and paper from 0 to 10 on a horizontal numerical rating scale and past experience of computers. Completion times were recorded.
Ethical approval was gained from the local research ethics committee, Redbridge and Waltham Forest, London.
Evaluation of the touch-screen HAQ, VAS scales and joint assessment questionnaire by patients in the clinic
In a separate study, 58 consecutive patients with RA attending the rheumatology clinic were invited to evaluate the touch-screen HAQ, VAS scales and joints questionnaires at their forthcoming clinic visit. Each participant was given a brief verbal introduction to the use of the touch screen and the joint assessment technique and then asked to complete the three touch-screen questionnaires unaided if possible. Each questionnaire concluded with the questions: ‘How easy was it for you to follow the on screen questions?’ and ‘How easy was it to understand the questions and decide on your answers?’ with response options of ‘Very easy’, ‘Quite easy’, ‘Quite difficult’ and ‘Very difficult’. Finally, an evaluation questionnaire queried past experience of computers and asked ‘Would you be willing to complete these touch-screen questionnaires at your next clinic visit?’ firstly ‘if it would help the doctor/nurse assess your condition’ and secondly ‘if the results were used to assess the condition of patients in general but not of you individually’. Response options to both were: ‘Yes, very willing’, ‘Yes, fairly wiling’, ‘No, fairly reluctant’ and ‘No, very reluctant’. The study nurse (with joint assessment training and experience) then completed a 28-joint count without knowledge of the patients’ answers on touch screen. The first 13 participants were randomized to complete the VAS scales on paper either before or after the touch-screen evaluation. The final 32 completed them both before and after.
In both studies the software recorded completion times as well as the use of the ‘review and amend’ sections. Any technical difficulties with the software and the number and nature of patient requests for help were recorded.
Analysis
DAS28 scores were calculated in the standard way, the conventional score using the paper VAS for global activity and the nurse-assessed joint counts, and a patient-derived score using the joint counts and global activity VAS by touch screen. To check for significant systematic differences between methods, paired t-tests were used for VAS and DAS scores and the Wilcoxon signed ranks test for joint counts, RAQol scores and completion times. To check for a possible relationship between score discrepancy and position on the scale, each score difference was plotted against the mid point between the touch-screen and paper or nurse score, and the Spearman coefficients calculated for the correlation between the two. To gauge the level of agreement, intraclass correlation coefficients (ICC) and standard deviations of score differences (touch-screen minus paper or nurse) were calculated. Mann–Whitney tests were used to check for significant differences in the times patients with and without past computer experience took to complete the touch-screen RAQol on and the ratings they gave it for ease of use.
Results
Touch-screen RAQol
Forty patients agreed to participate (23 female and 17 male). Their mean age was 65 yr with a range 44–83 yr. Three declined due to lack of time. No technical difficulties were experienced and all 40 participants, including one who was unable to hold a pencil, were able to complete it unaided. Four chose the ‘I cannot answer this question’ option for one item each on the touch screen. On paper three missed one item and one missed seven items.
The distribution of completion times was somewhat positively skewed for both methods. Patients took from 2 to 15 min (median 6 min) to complete the questionnaire on paper and 2 to 13 min (median 5 min) on touch screen. The difference was not significant (Wilcoxon signed ranks test two-tailed significance = 0.194, n = 38). The touch-screen completion times included a median of 1.5 min spent on the ‘review and amend’ section. Eight patients (20%) used this section to amend at least one response.
Twenty-five (64%) of 39 patients preferred the touch-screen RAQol, one (3%) preferred paper and 13 (33%) had no preference. The majority rated both paper and touch screen highly for ease of use. Twenty-seven (69%) gave a rating of 8 or more out of 10 to the paper version and 36 (90%) to the touch screen. The ratings for touch screen were significantly higher (Wilcoxon signed ranks test two-tailed significance = 0.003).
Twenty-four (62%) of the participants reported having rarely or never used a computer before. However, the majority of these rated the touch screen highly for ease of use, 21 of them (87.5%) offering a rating of 8 or more out of 10 and 15 preferring it to the paper version (eight had no preference). They gave significantly higher ease of use ratings to touch screen than to paper (Wilcoxon signed ranks two-tailed test significance 0.031, n = 24).
There was good comparability of the touch-screen and paper RAQol scores. The touch–paper score differences were not related to their position on the scale and were symmetrically distributed (Fig. 2) around a mean of −0.44 [95% confidence interval (CI) −0.94, 0.07], with a median of 0. The standard deviation of score differences of 1.6 (n = 39) and the ICC of 0.982 were comparable with the results of test–retest evaluation of a similarly extended paper RAQol in a previous study [7] (median 0, mean −0.3, s.d. 1.7, n = 59, ICC 0.986). Cronbach alpha for the touch-screen score was 0.922 compared with 0.944 for the paper score, demonstrating that the touch-screen version had retained a high level of internal consistency.
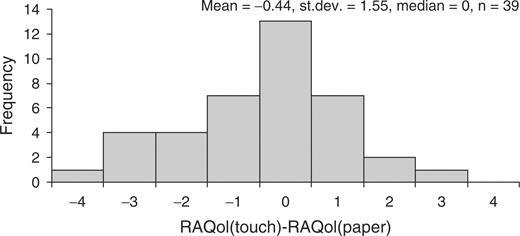
Touch-screen minus paper RAQol score differences.
Touch-screen HAQ, VAS and joint self-assessment
Thirty-seven women and eight men participated in the evaluation. Their ages ranged from 25 to 83 yr with a mean of 65 yr. Rheumatoid arthritis disease duration ranged from 3 to 44 yr with a mean of 19 yr. A total of 84.4% described their ethnic group as White UK/European, 11.1% as Asian, 2.2% as Black Caribbean 2.2% as Chinese and 2.2% as other. Twelve of the women and one of the men who had been sent the invitation letter did not participate. Their ages ranged from 36 to 85 yr with a mean of 66 yr and their disease duration from 4 to 29 yr with a mean of 16 yr. Of these 76.9% were white UK/European, 7.7% Asian, 7.7% Chinese, 0% Black Caribbean and 7.7% other. Reasons for non-participation were lack of time (46%), inadequate command of written English (8%) and failure to contact the study nurse on arrival in clinic (46%). Table 1 summarizes the participants’ scores for HAQ, pain, fatigue, global disease activity, ESR, joint counts and DAS28.
Participant scores for HAQ, joint counts, ESR, DAS28 and pain, fatigue and global disease activity
| n | Mean (s.d.) | Median | Lower quartile, upper quartile | ||
|---|---|---|---|---|---|
| HAQ | Touch screen | 45 | 1.61 (0.69) | 1.75 | 1.13, 2.06 |
| Pain VAS | Touch screen | 45 | 46 (23) | 40 | 25, 65 |
| Paper | 44 | 45 (22) | 46 | 29, 64 | |
| Fatigue VAS | Touch screen | 45 | 55 (22) | 50 | 35, 75 |
| Paper | 44 | 56 (21) | 50 | 37, 73 | |
| Global activity VAS | Touch screen | 45 | 49 (24) | 45 | 25, 75 |
| Paper | 45 | 45 (25) | 42 | 25, 69 | |
| Tender joints count | Self-assessed on touch screen | 45 | 10.4 (8.5) | 8.0 | 3.0, 15.0 |
| Nurse-assessed | 45 | 9.5 (8.2) | 7.0 | 2.5, 16.0 | |
| Swollen joint count | Self-assessed on touch screen | 45 | 5.9 (7.2) | 3 | 1.0, 9.5 |
| Nurse-assessed | 45 | 3.7 (5.1) | 1 | 0.0, 5.5 | |
| ESR | Routine blood test result (mm/h) | 44 | 28.1 (17.9) | 27.5 | 12.3, 38.5 |
| DAS28 | Patient-derived touch-screen DAS | 44 | 5.09 (1.47) | 5.07 | 4.04, 6.04 |
| Conventional paper/nurse DAS | 43 | 4.78 (1.44) | 4.97 | 3.82, 5.58 |
There were no technical problems with the touch-screen software. There was one request for assistance with the HAQ (interpreting a word) and five for the joint assessment (locating joints and further explanation of the terms tender and swollen). Three participants chose to view the optional ‘review and amend’ section of the HAQ but none used it to make an amendment. Ease of use evaluations are shown in Figs 3 and 4. The median time spent completing the questionnaires on touch screen was 6.8 min (ranging from 2.7 to 17.1 min) for HAQ, 1.2 min (ranging from 0.6 to 3.8 min) for the three VAS and 6.7 min (ranging from 3.4 to 16.4 min) for the joint assessment. Only two (4.4%) of participants said they would rather complete the assessment on paper and 17 (37.8%) had no preference.
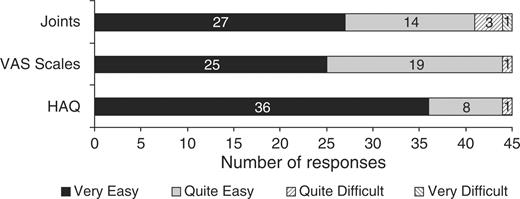
Patient responses to the question ‘How easy was it for you to follow the on screen questions?’ for each questionnaire.
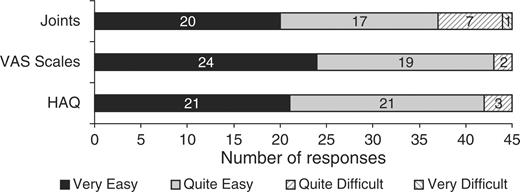
Patient responses to the question ‘How easy was it to understand the questions and decide on your answers?’.
Forty of the 45 participants stated that they would be very willing and three quite willing to complete the touch-screen assessment again at their next clinic visit if the results were to be used to help their doctor or nurse assess their own condition. Thirty-five stated they would be still be very willing and eight quite willing if the results were only to be pooled to assess the condition of patients in general. The 43 who would be very or quite willing to complete the touch-screen assessment at their next clinic visit whether the results were used to monitor their own condition or that of patients in general represented 95.6% of the participants or 74.2% of the 58 patients who had originally been invited to participate.
Twenty-nine of the participants reported that they had rarely or never used a computer before. Compared with the 16 with more computer experience, they were older (median age of 70 yr compared with 59 yr, Mann–Whitney two-tailed test significance 0.014), and took slightly longer to complete the assessment (a median total completion time of 16.6 min compared with 13.7 min). However, 28 (97%) of them rated the touch-screen instructions for both HAQ and VAS as very or quite easy to follow and 26 (90%) similarly rated the joint assessment. Twenty-seven (93%) said they would be very or quite willing to complete the assessment at a future clinic whether the results were used to help assess their own condition or just to assess the condition of patients in general.
There was marked positive skew of the distributions of both swollen and tender joint counts whether obtained by the nurse or by the patients on touch screen. Touch-screen and nurse tender count distributions were not significantly different (Wilcoxon signed ranks two-tailed significance 0.059) and individual differences were not significantly related to their position on the scale. The ICC was 0.918. The mean touch-screen minus nurse score differences was 0.84 (95% CI −0.14, 1.82) with a standard deviation of 3.26 and no significant skew. The swollen joint counts obtained by the patients on touch screen tended to be significantly higher than nurse-assessed swollen counts (Wilcoxon signed ranks two-tailed significance 0.002) and this difference tended to increase as the position on the scale increased (Spearman correlation coefficients 0.469, n = 45). The mean touch-screen minus nurse score differences was 2.13 (95% CI 0.81, 3.46) with a standard deviation of 4.41 and a significant positive skew. Poor agreement was also reflected in a lower ICC (0.698).
There were no significant differences between the mean touch-screen and paper VAS scores for pain, fatigue or global activity (paired t-tests significance = 0.691, 0.682 and 0.133, respectively, n = 44) and no significant relationship between their touch-screen minus paper score differences and position on the scale. The mean touch-screen minus paper score difference was 0.8 (95% CI −3.1, 4.7, s.d. 12.8) for pain, −1.1 (95%CI −6.7, 4.4, s.d. 18.3) for fatigue and 2.9 (95% CI −0.93, 6.79, s.d. 12.7) for global disease activity with significant negative skew for the fatigue scale differences. Agreement as measured by the ICCs was lower than for the RAQol (0.841 for pain, 0.630 for fatigue and 0.857 for global activity). However, when the results of the 32 participants who had completed the paper rating scales at both the beginning and end of the evaluation were examined, the standard deviations of the touch-screen–paper differences and the ICCs were found to be in the same order as for test–retest of the paper version (see Table 3).
The patient-derived touch-screen DAS scores were significantly higher than the conventional DAS scores (paired sample t-test two-tailed significance = 0.002, n = 43).
There was much intercorrelation between the various measures (see Table 2). Touch-screen swollen counts were significantly correlated with ESR, pain, global, fatigue and HAQ. Touch-screen tender counts were significantly correlated with pain, global disease activity and HAQ.
Spearman correlation coefficients
| ESR | Pain VAS (touch screen) | Global VAS (touch screen) | Fatigue VAS (touch screen) | Tender count (touch screen) | Swollen count (touch screen) | HAQ (touch screen) | Tender count (nurse) | |
|---|---|---|---|---|---|---|---|---|
| Pain VAS (touch screen) | 0.262 | |||||||
| Global VAS (touch screen) | 0.338* | 0.902** | ||||||
| Fatigue VAS (touch screen) | −0.037 | 0.364* | 0.325* | |||||
| Tender count (touch screen) | 0.144 | 0.391** | 0.464** | 0.180 | ||||
| Swollen count (touch screen) | 0.461** | 0.382** | 0.393** | 0.301* | 0.643** | |||
| HAQ (touch screen) | 0.362* | 0.389** | 0.466** | 0.285 | 0.512** | 0.302* | ||
| Tender count (nurse) | 0.106 | 0.369* | 0.405** | 0.163 | 0.917** | 0.614** | 0.481** | |
| Swollen count (nurse) | 0.327* | 0.347* | 0.251 | 0.252 | 0.461** | 0.666** | 0.276 | 0.486** |
*Significant at the 0.05 level (two-tailed).
**Significant at the 0.01 level (two-tailed).
Touch-screen–paper VAS score differences compared with test–retest differences for paper questionnaire (n = 32)
| Pain | Fatigue | Global disease activity | ||
|---|---|---|---|---|
| Mean score difference | Paper–paper | 2.1 | −0.9 | 1.6 |
| Touch–paper | 1.1 | −1.0 | 2.9 | |
| s.d. of score differences | Paper–paper | 11.3 | 14.9 | 11.9 |
| Touch–paper | 11.8 | 15.0 | 11.5 | |
| Intraclass correlation | Paper–paper | 0.865 | 0.746 | 0.863 |
| Coefficient | Touch–paper | 0.855 | 0.741 | 0.881 |
Discussion
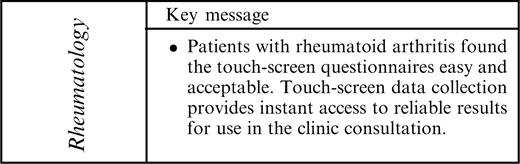
These studies suggest that ease of use and acceptance by patients present no barrier to the use of touch-screen questionnaires in the rheumatology clinic and that touch-screen questionnaires need take no longer to complete than the equivalent paper versions.
The high level of agreement found between touch-screen and paper RAQol scores demonstrated that where the same wording is used, touch-screen questionnaires can produce comparable results to a traditional paper version. Similarly, good reliability and equivalence between touch-screen and paper versions of other established questionnaires has also been demonstrated for the EORTC-QLQ-C30 quality of life in cancer questionnaire [14], the Quality of life in Reflux and Dyspepsia Questionnaire [15] and the Western Ontario and McMaster Universities Osteoarthritis Index (WOMAC) 3.1 [16]. As the ICCs for touch-screen to paper agreement for VAS pain, fatigue and global disease activity were as high as for test–retest of the paper versions, it is unlikely that score discrepancies arose primarily from translation of the questions onto touch screen.
The validity of the patients’ tender and swollen joint counts on touch screen was supported by the significant correlation between them and a wide range of other outcomes, from the objective ESR blood test to the highly subjective global assessment of disease activity. However, the significant difference between the swollen joint counts obtained by the patients on touch screen and those obtained by the nurse suggested that such patient-assessed joint counts should be regarded as distinct outcomes rather than as substitutes for counts by health professionals. Results demonstrated that touch-screen administration of the joint assessment questionnaire would be acceptable to the majority of patients. However, it was this questionnaire that required the most explanation in the verbal introduction, prompted the most requests for assistance from patients (five out of 45 asked for help) and for which the highest number reported difficulty with understanding and answering the questions (eight out of 45). It would be likely to make the most demands on staff time, and if included in a routine clinic assessment would require a nurse to be available to give an adequate explanation of the joint assessment technique and to provide occasional assistance. The touch-screen HAQ and RAQol by comparison were much more straightforward and required little explanation or assistance.
Touch-screen questionnaires can prevent accidental omission of questions but the observation that 10% of participants made use of an ‘I cannot answer this question’ option for at least one RAQol item confirmed that this feature is needed to avoid increasing apparent data completeness at the expense of validity.
Acceptability and reliability have been demonstrated for touch-screen questionnaires in other areas of medicine. A touch-screen version of the EORTC-QLQ-C30 quality-of-life questionnaire has been demonstrated to be acceptable to cancer patients [14, 17], and a survey of staff and patient attitudes [18] in a cancer pain clinic also found a touch-screen version to be readily used by patients. Velikova et al. [19] have demonstrated that the data derived from the touch-screen computer version of the EORTC-QLQ-C30 provided more information than the medical notes on symptoms and functional issues.
In rheumatology Wilson et al. [20] used an electronic version of the Medical Outcomes Studies Short Form questionnaire (SF 36) to assess patients with systemic lupus erythematosus and vasculitis. Individuals were asked to use a standard mouse to navigate through the questionnaire. A high level of correlation between computer and paper versions was observed, and the electronic version was found to be acceptable, with 71% of patients rating the electronic version highly for ease of use. However, a touch-screen interface is more suitable for the many RA clinic patients unfamiliar with the use of a mouse. Our work has specifically explored the use of touch-screen technology in clinic patients with RA where upper limb function, age and lack of familiarity with computers are important factors to be considered in the design and evaluation of electronic questionnaires. Athale et al. [21] have used a quite different approach to the design of electronic versions of the HAQ, VASs and joint counts (but not the RAQol) and, despite very significant differences in questionnaire design and in the participating patients, have also demonstrated the acceptability of computer-based questionnaires to patients and comparability of scores with paper versions. Their questionnaire was web-based, not designed specifically for touch-screen administration, and quite different in style from ours. For example, their joint assessment questionnaire presented all the joints on screen together while ours presented one joint at a time. We had observed in trials of development versions of the program that patients frequently failed to check every joint when all were presented at once. They tested their programs in a somewhat different sample of patients to ours, 43 attending a US university-based clinic as opposed to 45 attending a routine rheumatology clinic in an urban district general hospital in the UK. Their patients had a much shorter disease duration with a median of only 6 yr compared our median of 15 yr and were generally much younger (41.8% aged under 55 yr compared with 13.4% of ours, 32.6% over 65 yr compared with 51.1% of ours). An overriding requirement for our questionnaires was that as many patients as possible should feel comfortable using them without assistance regardless of age or previous computer experience. Using very simple instructions, in large print on uncluttered screens with very straightforward consistent methods of navigation, we were successful in developing touch-screen questionnaires that were acceptable to and useable by the vast majority of the largely elderly and computer naïve patients attending for routine appointments.
We have demonstrated that the use of touch-screen computer questionnaires in the clinic is a feasible way of overcoming many practical issues that currently limit the collection and utilization of outcome data in routine rheumatology practice. Touch-screen questionnaires can produce comparable results to paper, eliminate the need for data entry, afford immediate access to results and be a highly acceptable and in many cases a preferable option to paper, regardless of patient age and previous experience of computers. Further work will involve the trial in clinic of a trolley-style touch-screen unit designed to be comfortable for patients and secure and robust enough for routine use.
This research was undertaken as part of the NHS R&D programme ‘Rheumatic Disease: Improving Outcome and Quality of Life’. The authors would like to thank Whipps Cross University Hospital NHS Trust and the Stone Forum for support in providing funding, rheumatology nurse practitioner Margaretta Rooney, biologics specialist nurse Martina Cooney, the staff of the rheumatology clinic and the patients who gave their time to test the questionnaire. M.C.G. would also like to thank the Nightingale Foundation and the Outer London Education Consortium who provided funding towards the MSc in Medical Informatics of which this study was a part.
The authors have declared no conflicts of interest.
References
Guillemin F. Functional disability and quality-of-life assessment in clinical practice.
Wolfe F, Pincus T. Listening to the patient. A practical guide to self-report questionnaires in clinical care.
Scott DL, Antoni C, Choy EH, Van Riel PC. Joint counts in routine practice.
Fries JF, Spitz P, Kraines G, Holman H. Measurement of patient outcome in arthritis.
Higginson IJ, Carr AJ. Using quality of life measures in the clinical setting.
de Jong Z, Van Der Heijde D, McKenna SP, Whalley D. The reliability and construct validity of the RAQol: a rheumatoid arthritis specific quality of life instrument.
Tijhius GJ, de Jong Z, Zwinderman AH et al. The validity of the Rheumatoid Arthritis Quality of Life (RAQol) questionnaire.
Greenwood MC, Hakim AJ, Doyle DV. Can the rheumatoid arthritis quality of life questionnaire be extended to provide greater insight into specific patient concerns without losing validity?
Fuchs HA, Brooks RH, Callahan LF, Pincus T. A simplified twenty-eight-joint quantitative articular index in rheumatoid arthritis.
Prevoo ML, van't Hof MA, Kuper HH, van Leeuwen MA, van de Putte LB, van Riel PL. Modified disease activity scores that include twenty-eight-joint counts. Development and validation in a prospective longitudinal study of patients with rheumatoid arthritis.
Houssien DA, Stucki G, Scott DL. A patient-derived disease activity score can substitute for a physician–derived disease activity score in clinical research.
Dwyer KA, Coty MB, Smith CA, Dulemba S, Wallston KA. A comparison of two methods of assessing disease activity in the joints.
Velikova G, Wright EP, Smith AB et al. Automated collection of quality of life data: a comparison of paper and pencil and computer touch-screen questionnaires.
Kleinman L, Leidy NK, Crawley J, Bonomi A, Schoenfield P. A comparative trial of paper-and-pencil versus computer administration of the Quality of Life in Reflux and Dyspepsia (QOLRAD) questionnaire.
Bischoff-Ferrari HA, Vondechend M, Bellamy N, Theiler R. Validation and patient acceptance of a computer touch screen version of the WOMAC 3.1 osteoarthritis index.
Buxton J, White M, Osoba D. Patient experiences using a computerised program with a touch sensitive video monitor for the assessment of health related quality of life.
Carlson LE, Speca M, Hagen N, Taenzer P. Computerised quality of life screening in a cancer pain clinic.
Velikova G, Wright P, Smith AB et al. Self-reported quality of life of individual cancer patients: concordance of results with disease course and medical records.
Wilson AS, Kitas GD, Carruthers DM et al. Computerised information gathering in specialist rheumatology clinics: an initial evaluation of an electronic version of the Short Form 36.
Author notes
The Academic Rheumatology and Osteoporosis Unit, Whipps Cross University Hospital NHS Trust, Leytonstone, London E11 1NR and 1Centre for Health Informatics, City University, Northampton Square, London EC1V 0HB, UK.

Comments